Applied

Math to Power Industry 2022 Gala

Speaker: 
Kristine Bauer
Dhavide Aruliah
Date: 
Thu, Jul 28, 2022
Location: 
Zoom
Online
Conference: 
m2pi2022
Abstract: 

Math^Industry is an annual workshop organized by the Pacific Institute for the Mathematical Sciences to bring together graduate students, academics and industrial partners to work on real world problems. Practical problems from industry are framed by industry partners and project teams are formed to tackle them. The workshop culminates in a gala event where the results of the work on each project is presented.

The gala event took place on zoom and the project reports were presented in three breakout rooms. In the video below, the recordings from these rooms have been placed one after the other and the start time of each is give in square brackets below.

Subject: 

Symmetry, bifurcation, and multi-agent decision-making

Speaker: 
Naomi Leonard
Date: 
Mon, Oct 1, 2018
Location: 
PIMS, University of British Columbia
Conference: 
IAM-PIMS Distinguished Colloquium Series
Abstract: 

I will present nonlinear dynamics for distributed decision-making that derive from principles of symmetry and bifurcation. Inspired by studies of animal groups, including house-hunting honeybees and schooling fish, the nonlinear dynamics describe a group of interacting agents that can manage flexibility as well as stability in response to a changing environment.

Biography:

Naomi Ehrich Leonard is Edwin S. Wilsey Professor of Mechanical and Aerospace Engineering and associated faculty in Applied and Computational Mathematics at Princeton University. She is a MacArthur Fellow, and Fellow of the American Academy of Arts and Sciences, SIAM, IEEE, IFAC, and ASME. She received her BSE in Mechanical Engineering from Princeton University and her PhD in Electrical Engineering from the University of Maryland. Her research is in control and dynamics with application to multi-agent systems, mobile sensor networks, collective animal behavior, and human decision dynamics.

Sparse Recovery Using Quantum Annealing - Final Report

Speaker: 
Aritra Dutta
Geonwoo Kim
Meiqin Li
Carlos Ortiz Marrero
Mohit Sinha
Cole Stiegler
Date: 
Fri, Aug 14, 2015
Location: 
Institute for Mathematics and its Applications
Conference: 
PIMS-IMA Math Modeling in Industry XIX
Abstract: 

The main optimization problem in many applications in signal processing (e.g. in image reconstruction, MRI, seismic images, etc.) and statistics (e.g. model selection in regression methods), is the following sparse optimization problem. The goal is finding a sparse solution to the underdetermined linear system Ax = b, where A is an m x n matrix and b is an m-vector and m ≤ n [2]. The problem can be written as

min (over x) ||x||₁ subject to Ax = b.

There are several approaches to this problem that generally aim at approximate solutions, and often solve a simplified version of the original problem. For example passing from ℓ-norm to ℓ₁-norm yields an interesting convexification of the problem [1]. Moreover the equality Ax = b does not cover noisy cases in which Ax + r = b for some noise vector r

min (over x) ||x||₁ subject to ||Ax - b||₂ ≤ σ.

Extensive theoretical [6, 7] and practical studies [5, 8] have been carried on solving this problem and various succesfull methods adopting interior-point algorithms, gradient projections, etc. have been tested. The discrete nature of the original problem also suggests possibility of viewing the problem as a mixed-integer optimization problem [3]. However common methods for solving such mixed-integer optimization problems (e.g. Benders’ decomposition) iteratively generate hard binary optimization subproblems [4]. The exciting possibility that quantum computers may be able to perform certain computations faster than digital computers has recently spiked with the quantum hardware of D-Wave systems. The current implementations of quantum systems based on the principles of quantum adiabatic evolution, provide experimental resources for studying algorithms that reduce computationally hard problems to those that are native to the specific evolution carried by the system. In this project we will explore possibilities of designing optimization algorithms that use the power of quantum annealing in solving sparse recovery problems.

References
[1] Emmanuel J. Cand´es, Justin K. Romberg, and Terence Tao. Stable signal recovery from incomplete and inaccurate measurements. Communications on Pure and Applied Mathematics, 59(8):1207–1223, 2006.
[2] Simon Foucart and Holger Rauhut. A Mathematical Introduction to Compressive Sensing. Birkh¨user Basel, 2013.
[3] N.B. Karahanoglu, H. Erdogan, and S.I. Birbil. A mixed integer linear programming formulation for the sparse recovery problem in compressed sensing. In Acoustics, Speech and Signal Processing (ICASSP), 2013 IEEE International Conference on, pages 5870–5874, May 2013.
[4] Duan Li and Xiaoling Sun. Nonlinear Integer Programming. International Series in Operations Research & Management Science. Springer, 2006.
[5] Ewout van den Berg and Michael P. Friedlander. SPGL1: A solver for large-scale sparse reconstruction, June 2007. http://www.cs.ubc.ca/labs/scl/spgl1.
[6] Ewout van den Berg and Michael P. Friedlander. Probing the pareto frontier for basis pursuit solutions. SIAM Journal on Scientific Computing, 31(2):890–912, 2008.
[7] Ewout van den Berg and Michael P. Friedlander. Sparse optimization with least-squares constraints. SIAM J. Optimization, 21(4):1201–1229, 2011.
[8] Ewout van den Berg, Michael P. Friedlander, Gilles Hennenfent, Felix J. Herrmann, Rayan Saab, and ¨Ozg¨ur Yilmaz. Algorithm 890: Sparco: A testing framework for sparse reconstruction. ACM Trans. Math. Softw., 35(4):29:1–29:16, February 2009.

Deducing Rock Properties from Spectral Seismic Data - Final Report

Speaker: 
Maria-Veronica Ciocanel
Heather Hardeman
Dillon Nasserden
Byungjae Son
Shuai Ye
Date: 
Fri, Aug 14, 2015
Location: 
Institute for Mathematics and its Applications
Conference: 
PIMS-IMA Math Modeling in Industry XIX
Abstract: 

Seismic Data in Exploration Geoscience

The recovery and production of hydrocarbon resources begins with an exploration of the earth’s subsurface, often through the use of seismic data collection and analysis. In a typical seismic data survey, a series of seismic sources (e.g. dynamite explosions) are initiated on the surface of the earth. These create vibrational waves that travel into the earth, bounce off geological structures in the subsurface, and reflect back to the surface where the vibrations are recorded as data on geophones. Computer analysis of the recorded data can produce highly accurate images of these geological structures which can indicate the presence of reservoirs that could contain hydrocarbon fluids. High quality images with an accurate analysis by a team of geoscientists can lead to the successful discovery of valuable oil and gas resources. Spectral analysis of the seismic data may reveal additional information beyond the geological image. For instance, selective attenuation of various seismic frequencies is a result of varying rock properties, such as density, elasticity, porosity, pore size, or fluid content. In principle this information is present in the raw data, and the challenge is to find effective algorithms to reveal these rock properties.

Spectral Analysis

Through the Fourier transform, frequency content of a seismic signal can be observed. The Short Time Fourier transform is an example of a time-frequency method that decomposes a signal into individual frequency bands that evolve over time. Such time-frequency methods have been successfully used to analyze complex signals with rich frequency content, including recordings of music, animal sounds, radio-telescope data, amongst others. These time-frequency methods show promise in extracting detailed information about seismic events, as shown in Figure 1, for instance.

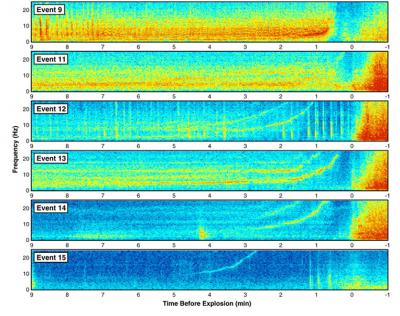
Figure 1: Sample time-frequency analysis of a large seismic event (earthquake). From Hotovec, Prejean, Vidale, Gomberg, in J. of Volcanology and Geothermal Research, V. 259, 2013.

Problem Description

Are existing time-frequency analytical techniques effective in providing robust estimation of physical rock parameters that are important to a successful, economically viable identification of oil and gas resources? Can they accurate measure frequency-dependent energy attenuation, amplitude-versus-offset effects, or other physical phenomena which are a result of rock and fluid properties?

Using both synthetic and real seismic data, the goal is to evaluate the effectiveness of existing time-frequency methods such as Gabor and Stockwell transforms, discrete and continuous wavelet transforms, basis and matching pursuit, autoregressive methods, empirical mode decomposition, and others. Specifically, we would like to determine whether these methods can be utilized to extract rock parameters, and whether there are modifications that can make them particularly effective for seismic data.

The source data will include both land-based seismic surveys as well as subsurface microseismic event recordings, as examples of the breadth of data that is available for realistic analysis.

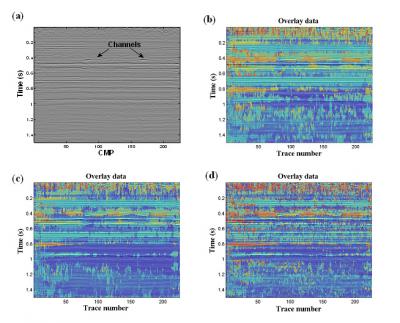
Figure 2: (a). Seismic data set from a sedimentary basin in Canada. The erosional surface and channels are highlighted by arrows. The same frequency attribute are extract from short time Fourier transform (b), continuous wavelet transform (c) and empirical mode decomposition (d).

Deep Learning for Image Anomaly Detection - Final Report

Speaker: 
Ross Churchley
Omeiza Olumoye
Emily Gunawan
Morgan Schreffler
Deyeob Yeo
Date: 
Fri, Aug 14, 2015
Location: 
Institute for Mathematics and its Applications
Conference: 
PIMS-IMA Math Modeling in Industry XIX
Abstract: 

The machine learning community has witnessed significant advances recently in the realm of image recognition [1,2]. Advances in computing power – primarily through the use of GPUs – has enabled a resurgence of neural networks with far more layers than was previously possible. For instance, the winning team, GoogLeNet [1,3], at the ImageNet 2014 competition triumphed with a 43.9% mean average precision, while the previous year’s winner, University of Amsterdam, won with 22.6% mean average precision.

Neural networks mimic the neurons in the brain. As in the human brain, multiple layers of computational “neurons” are designed to react to a variety of stimuli. For instance, a typical scheme to construct a neural network could involve building a layer of neurons that detects edges in an image. An additional layer could then be added which would be trained (optimized) to detect larger regions or shapes. The combination of these two layers could then identify and separate different objects present in a photograph. Adding further layers would allow the network to use the shapes to decipher the types of objects recorded in the image.

Goal of this project

An issue facing industries that deal with large numbers of digital photographs, such as magazines and retailers, is photo accuracy. Nearly all photos used in such contexts undergo some amount of editing (“Photoshopping”). Given the volume of photographs, mistakes occur [4]. Many of these images fall within a very narrow scope. An example would be the images used within a specific category of apparel on a retailer’s website. Detecting anomalies automatically in such cases would enable retailers such as Target to filter out mistakes before they enter production. By training a modern deep convolution neural network [1,5] on a collection of correct images within a narrow category, we would like to construct a network which will learn to recognize well-edited images. This amounts to learning a distribution of correct images so that poorly-edited images may be flagged as anomalies or outliers.

Keywords: neural networks, deep learning, image processing, machine learning

Prerequisites: Programming experience in Python. Experience in a Linux environment is a plus.

Fast and Somewhat Accurate Algorithms - Final Report

Speaker: 
Mario Barela
Su Chen
Emily Gunawan
Morgan Schreffler
Deyeob Yeo
Date: 
Fri, Aug 14, 2015
Location: 
Institute for Mathematics and its Applications
Conference: 
PIMS-IMA Math Modeling in Industry XIX
Abstract: 

In applications such as image processing, computer vision or image compression, often times accuracy and precision are less important than processing speed as the input data is noisy and the decision making process is robust against minor perturbations. For instance, the human visual system (HVS) makes pattern recognition decisions even though the data is blurry, noisy or incomplete and lossy image compression is based on the premise that we cannot distinguish minor differences in images. In this project we study the tradeoff between accuracy and system complexity as measured by processing speed and hardware complexity.

Knowledge of linear algebra, computer science, and familiarity with software tools such as Matlab or Python is desirable. Familiarity with image processing algorithms is not required.

Fig. 1: error diffusion halftoning using Shiau-Fan error diffusion

Fig. 2: error diffusion halftoning using a single lookup table

References:
1. Wu, C. W., "Locally connected processor arrays for matrix multiplication and linear transforms," Proceedings of 2011 IEEE International Symposium on Circuits and Systems (ISCAS), pp.2169,2172, 15-18 May 2011.

2. Wu, C. W., Stanich, M., Li, H., Qiao, Y., Ernst, L., "Fast Error Diffusion and Digital Halftoning Algorithms Using Look-up Tables," Proceedings of NIP22: International Conference on Digital Printing Technologies, Denver, Colorado, pp. 240-243, September 2006.

Simulation-driven Design in the Development of High-performance Tools - Final Report

Speaker: 
Hye Jun Jang
Rahul Kumar
Argyrios Petras
Yaowei Zhang
Heng Zhu
Date: 
Fri, Aug 14, 2015
Location: 
Institute for Mathematics and its Applications
Conference: 
PIMS-IMA Math Modeling in Industry XIX
Abstract: 

Developing a product to attain market maturity is a long process. Within this process it is important to make the right decisions, especially when conflicting goals arise. These are typically defined by ambitious product requirements in partly competing dimensions.

In the development of electric tools and accessories, such as those produced in a mechanical engineering enterprise like Hilti, lightweight construction, long-life cycle, robustness, high performance and low costs are typical targets. Regarding so called combis and breakers (see Figure 1) there exist corresponding key values, which help the customer to assess the product: single impact energy, weight, rated power, operator’s comfort, vibration level. The implication of these user oriented requirements present the most challenging task for development in generating a lightweight design having high performance and robustness. The task is especially demanding due to high dynamics inherent in the tools, causing very complex impact loads.

Combis and breakers achieve their huge performance from the so called electro-pneumatic hammering mechanism: ‘the heart of the tool.’ It consists of several pistons that achieve high velocities and a pneumatic spring which generates high pressures. The interaction of these different machine parts leads to very high stresses for the tool components, requiring a particularly robust design.

In this project we will perform a case study of a simulation based design, where we will pick up a real-life problem from industry, the so called chuck of a combi-hammer. As mentioned above, throughout its entire life time the chuck is frequently loaded by high impact. During our development process we have to ensure that the chuck subassembly reaches the lifetime target in a robust and reliable design. We will also practice team-based strategies to master all the unexpected difficulties arising in any complex collaborative development process.

The structure of the workshop will be a sequence of short introductory lectures, student’s research and intensive discussion phases.


Is this a compressed sensing application? - Final Report

Speaker: 
Abhishek Agarwal
Dimitrios Karslidis
Byong Kwon
Shant Mahserejian
Kevin Palmowski
Xuping Xie
Date: 
Fri, Aug 14, 2015
Location: 
Institute for Mathematics and its Applications
Conference: 
PIMS-IMA Math Modeling in Industry XIX
Abstract: 

Cyber Optics designs and manufacturers some of the most capable 3D measurement systems in the world. These systems are based on Phase Profilometry, and sample a large amount of data, to construct a single 3D Height Image. The ratio of data collected to data output can be as high as 30 to 1. This process of sensing massive amounts of data and outputting a small fraction of the sensed data, is a common problem in sensor design. In the past decade a new branch of mathematics and sensor design has emerged called compressed sensing that specifically addresses this problem. In compressed sensing the sensor designer exploits these massive compressive ratios to “sense” a more limited data set.

My team will determine the feasibility of compressed sensing as applied to the Cyber Optics Phase Profilometry sensor. I (the presenter) have no experience with compressed sensing, but I have 4 years of experience working with phase profilometry, and 20+ years working as a mathematician in industry. We will explore the literature of compressed sensing, and present a “go – no-go” analysis of phase profilometry to my management. That is, we will attempt to address the question, “can compressed sensing be used to reduce the data collection requirements of our sensors by at least an order of magnitude”?

Approximate Mapping of Temperatures from Coarser to Finer Grid using Temporal Derivatives - Final Report

Speaker: 
Ilona Ambartsumyan
Cuiyu He
Eldar Khattatov
Sewoong Kim
Lidia Mrad
Minho Song
Date: 
Fri, Aug 14, 2015
Location: 
Institute for Mathematics and its Applications
Conference: 
PIMS-IMA Math Modeling in Industry XIX
Abstract: 

In many practical situations encountered in industries, there is incomplete knowledge of material properties, boundary conditions, and sources for a given material/manufacturing process. However, process monitors such as thermocouples are typically used to measure temperature evolution in certain locations to bridge the resulting gaps. Spatial gradients of temperature are needed to predict required quantities such as internal stresses developed during the process. The temperature measurements are typically performed on a coarse grid. Computation of stresses needs temperatures on a much finer grid for a more precise estimation of spatial gradients. Usually bilinear and/or weighted interpolation techniques are used to improve the spatial resolution of temperatures. However, in the cases where there are strong exothermic and/or endothermic reactions occurring during the process, such interpolation techniques are error-prone. Using more thermocouples to measure temperature on finer grid would be an easy solution. However, such measurement is intrusive as well as perturbing in addition to increasing the cost of data acquisition. The mapping of temperatures from coarser grid to finer grid is an ill-posed problem. In addition to the spatial distribution temperatures, the thermocouple measurements also contain valuable temporal information in the form of derivatives. This additional information of temporal derivatives helps in improving the conditioning of the apparently ill-posed problem. The objective of this exercise is to develop an algorithm/procedure for mapping temperatures from coarse grid to a finer grid recognizing as well as the valuable temporal information in the corresponding derivatives.

Pages